IPL Dataset Analysis through Visualization
Dataset Description:
This dataset offers a comprehensive look at cricket match statistics and player performance, potentially covering a T20 league like the IPL. It's designed to fuel data analysis and visualization projects

India FDI Data Analysis and Trends Viz
India's Foreign Direct Investment (FDI) landscape showcases a diverse range of sectors and a promising future. Sectors like boilers, agricultural machinery, and air transport receive the least FDI, while the automobile industry, though in the bottom five, still attracts significant investment.


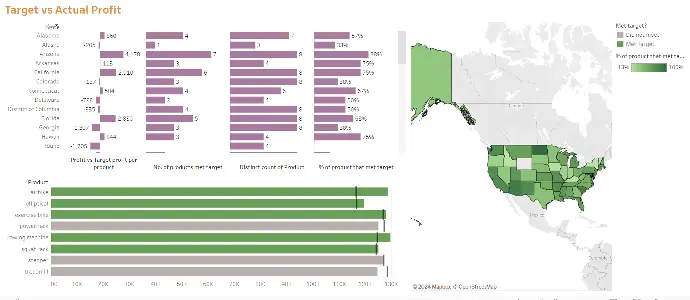
Target vs Actual Profit achieved by Product
The dataset used for this Tableau visualization likely contains information about product sales and targets for different states in the United States. It includes:
- State: The state where the sales occurred.
- Product: The type of product sold (e.g., airbike, elliptical, treadmill).
- Actual Profit: The actual profit made from the product sales.
- Target Profit: The target profit set for the product sales.

Netflix Content Analysis Dashboard
This interactive dashboard provides a visual exploration of Netflix content, including global distribution, genre popularity, ratings breakdown, and historical trends. Utilizing various chart types and a world map, it offers insights into the diverse landscape of movies and TV shows available on the platform.

British Airways Customer Experience Dashboard
This comprehensive dashboard visualizes British Airways customer reviews, focusing on seat comfort across various dimensions.
It explores trends over time, geographical variations, and aircraft-specific ratings, providing valuable insights into passenger satisfaction and areas for potential improvement.

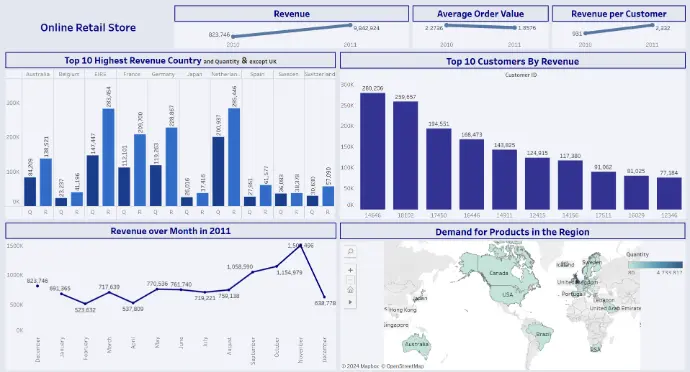
Online Retail Store Analysis
This is an interactive dashboard that is built while the job simulation of Tata's data vizualization on Forage. It was a successfully completed project. To know more, click on the blog button.